
estimated visitors
Development retrospective · 6 MIN READ
Three months of building across the Polinaria workspace
Twenty repositories, 920 issues, and a closer look at the work still between an idea and a running service.
Nearly three months across twenty repositories
I wanted to step back and see how development across my Polinaria workspace has actually been going. Following individual issues makes it easy to remember the problem in front of me and lose track of the wider pattern.
The view from July 19 to October 14, 2026 covers twenty repositories: the music and lighting projects, ProjectMan, F34, shared tools, and the infrastructure that holds them together. Across that set, the snapshot contains 920 issues: 646 closed and 274 still open.
That is a substantial amount of recorded work. It also leaves a substantial queue. The interesting questions are how that queue grew, which work has been sitting around, and what still separates a proposed change from something running reliably.
August dominates the record
August accounts for more than half of the issues created in this period. It also has the most closures. September was quieter by both measures, while October is still only a partial month.
| Period | Issues opened | Issues closed | Open issues at period end |
|---|---|---|---|
| July 19–31 | 27 | 9 | 18 |
| August | 517 | 350 | 185 |
| September | 231 | 173 | 243 |
| October 1–14, partial | 145 | 114 | 274 |
These are counts of records, with all the differences in scope that implies. A small correction and a large architectural investigation each count as one issue. The August spike cannot tell us how much code was written or whether work was newly discovered, split into smaller pieces, or entered into the tracker.
The backlog nevertheless tells a clear story: new issues have continued to arrive faster than existing issues close.
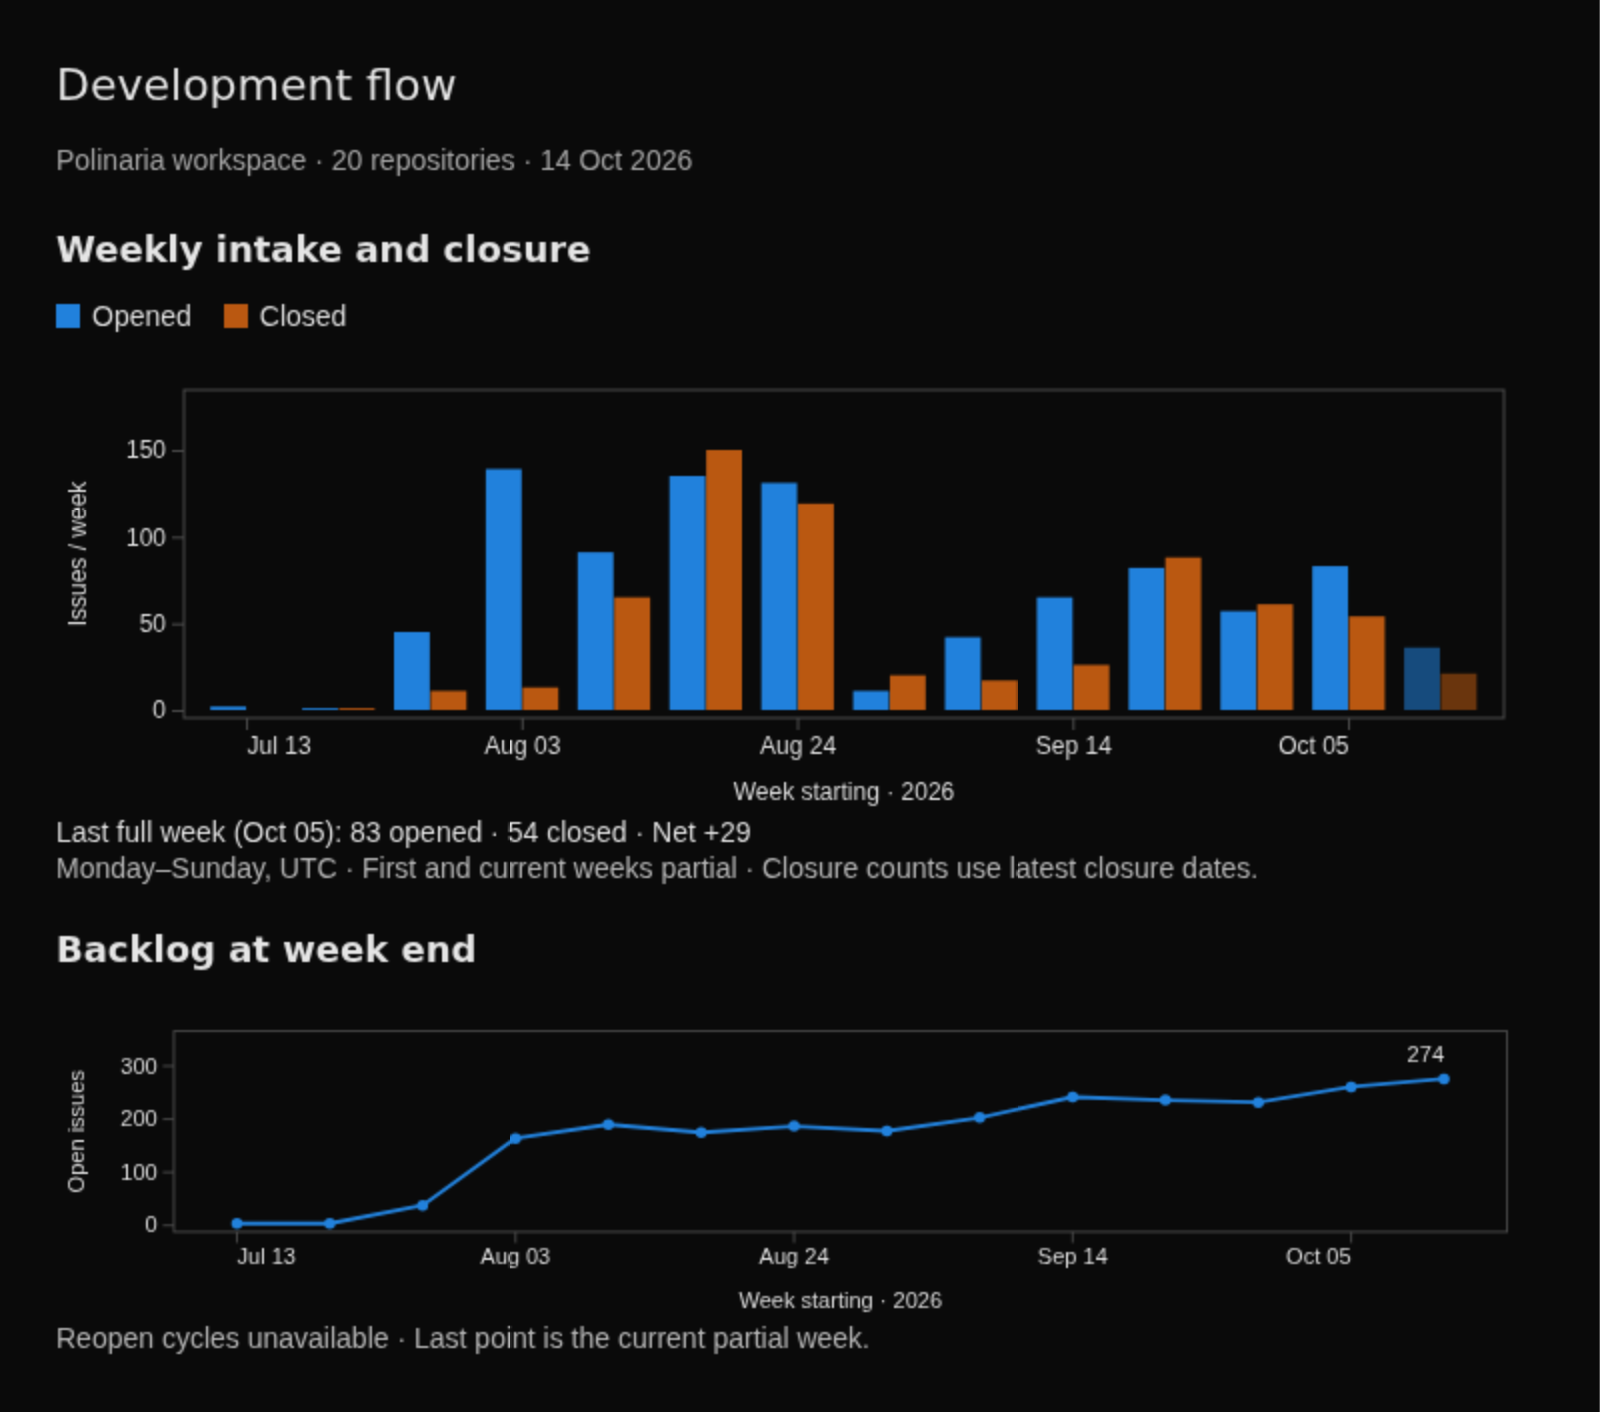
Weekly intake and closure, followed by the open backlog. Snapshot: October 14, 2026. Select the image to view it at full size.
The first and current weeks in the chart are partial. Historical counts are reconstructed from creation dates and the latest closure date; intervening reopen cycles are not available in this snapshot.
The weekly view makes that growth more concrete. In the last complete week, October 5–11, 83 issues opened and 54 closed, adding 29 to the reconstructed backlog. The previous week went the other way: 57 opened and 61 closed. There are weeks where the queue shrinks, even though the overall trend is upward.
Much of the work concerns how the systems hold together
The closed issue record includes recurring work on persistence, access boundaries, recovery, and delivery. F34 has entries covering atomic item updates, visibility on project pages, and moving schema migrations out of web-request startup. ProjectMan has entries around durable synchronization, concurrent history updates, and preserving state during replication and compatibility work.
The infrastructure record includes deployment observation, stale deployed revisions, resource pressure, and the shared tools agents use to collaborate. MixMan's record includes session authority, planner behavior, analysis ownership, and data-compatible migrations.
Those threads help explain what is occupying development attention. A workspace of connected applications needs reliable handoffs between them: who can change a record, which version is running, what survives a restart, and how a failed operation can be retried. Those concerns recur across projects with very different user-facing purposes.
A closed issue records a closed piece of tracked work. Confirming the deployed result requires following its implementation and delivery evidence further.
The older backlog deserves its own view
Of the 274 open issues, 136 are at least thirty days old. The median age is 29.8 days; the 90th percentile is 71.0 days. Age here means time since issue creation, not time spent actively working on it.
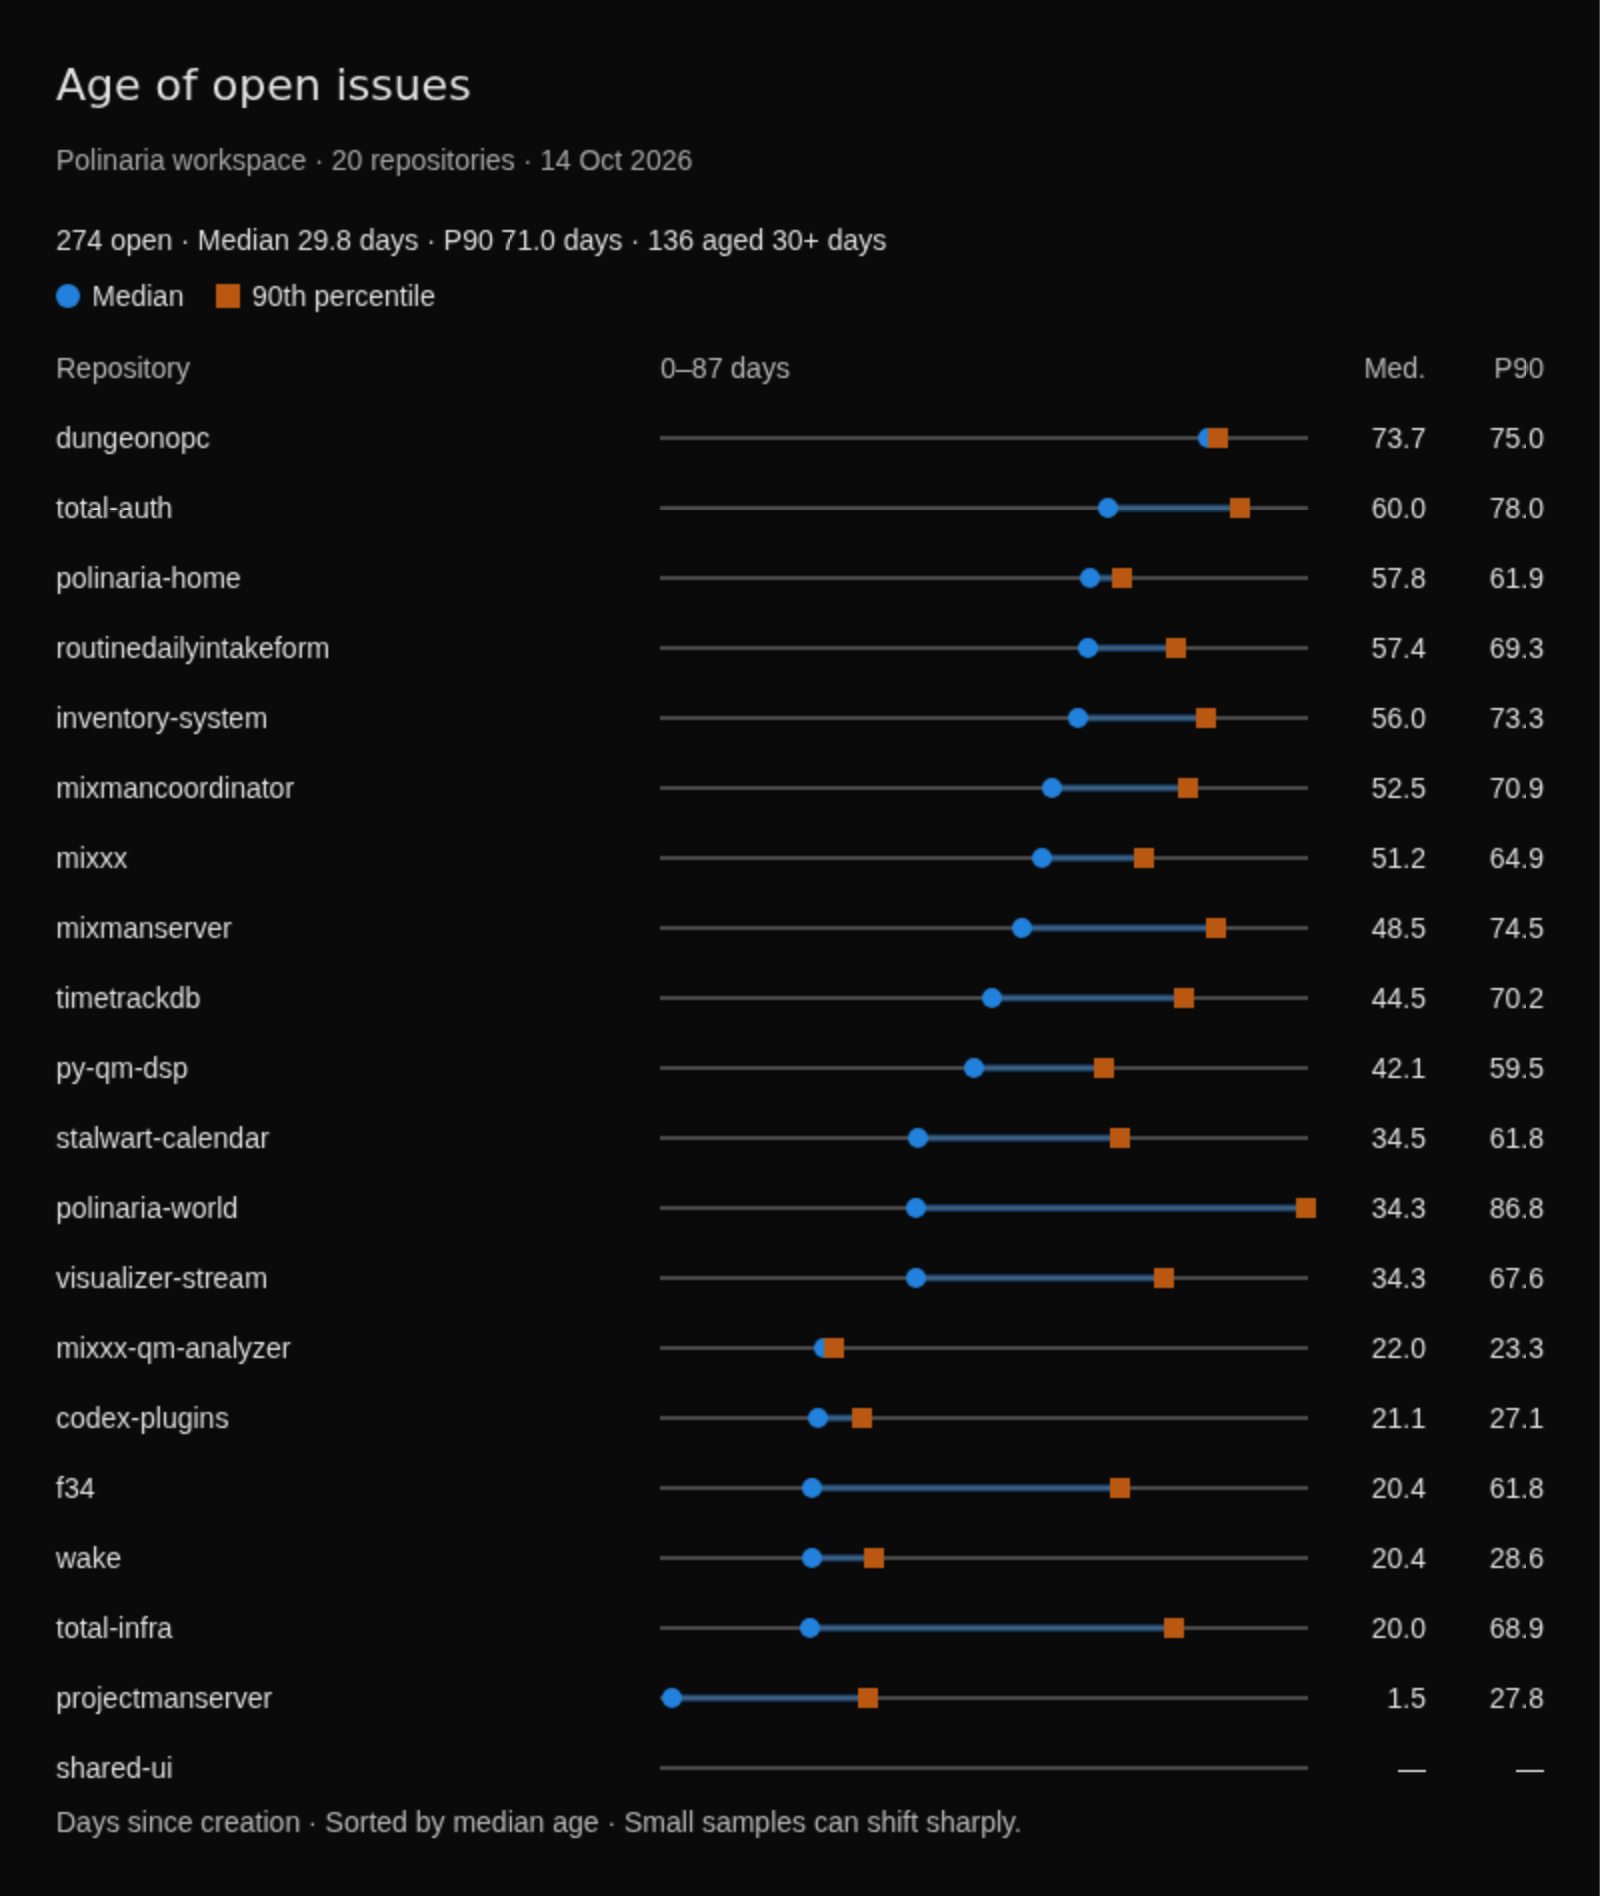
Age of open work across all twenty repositories. Circles show the median; squares show the 90th percentile. Select the image to view it at full size.
The repositories have quite different age profiles. ProjectMan's open issues have a median age of about 1.5 days, while DungeonOPC's median is about 73.7 days. That difference points to different queues to inspect. It does not establish that one project is moving faster: recent discovery, retained roadmap work, and issue size all affect the comparison.
The largest open queues are Total Infra with 66 issues and MixMan Server with 45. Together they account for 111 of the 274 open issues, or roughly 41 percent. Shared infrastructure and the music server therefore make a useful starting point for understanding the volume of outstanding work.
For older items, I want to make the next decision explicit: continue the work, clarify what completion means, resolve a dependency, or deliberately retain it for later. An old issue can still be valuable. Its age is a reason to inspect its purpose.
The delivery queue has several different stopping points
The pull request snapshot contains 38 open PRs, including 25 drafts. Three target feature branches, so their immediate destination is another piece of ongoing work.
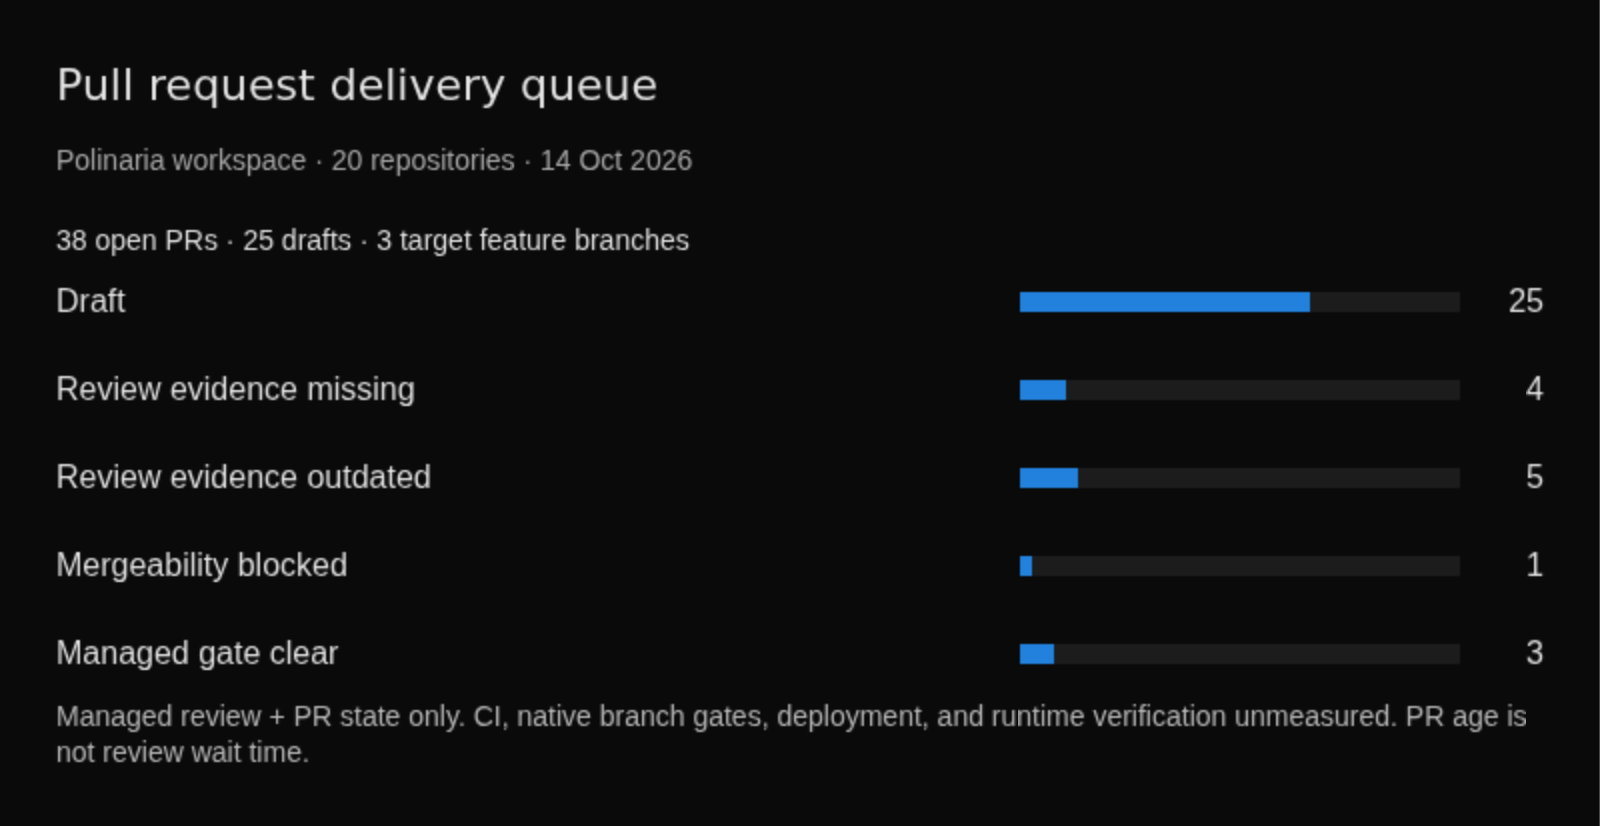
The open delivery queue, including drafts. A clear managed gate does not establish CI or deployment status. Select the image to view it at full size.
The thirteen non-draft PRs were checked against the managed review gate for their current proposed commits and target commits:
| Observed state | PRs |
|---|---|
| Review evidence missing | 4 |
| Review evidence outdated | 5 |
| Mergeability blocked, also with outdated evidence | 1 |
| Managed review gate clear | 3 |
Review evidence can become outdated when the proposed change or its target changes. A previous review may remain useful, but the recorded approval must apply to what would actually be integrated.
The three clear results cover the managed review gate and observed PR state. Required CI, native branch rules, deployment, and runtime verification remain separate checks. This view does not measure their outcomes.
That distinction gives the queue practical value. Different changes need different next steps: finish draft work, obtain a review, refresh an existing review, resolve mergeability, or continue through the remaining delivery checks.
What I want to track next
The useful recurring view has three parts: weekly intake and closure, the age of open work, and the next unmet step for each proposed change. Together they explain more than a single total of closed issues.
I also want to connect that view to deployment evidence. A change can be reviewed and merged while the running service still uses an earlier revision. Reporting the deployed version and its verification alongside the implementation would make that gap visible.
The last nearly three months show sustained closure activity alongside a growing backlog and a sizable draft queue. The next improvement is to make the remaining work easier to act on: clear destinations, current review evidence, and an observable path from implementation to the systems I actually use.
Snapshot: October 14, 2026. Issue data collected at 15:52 UTC; pull requests at approximately 16:01 UTC, with managed review checks immediately afterward. Coverage is the twenty repositories in the workspace collaboration inventory. Pull requests are excluded from issue totals. The figures describe tracked work and do not measure developer productivity or production delivery.
PROJECT